This article is a part of a bigger theme : managing liquidity risk >>
MikeMoneyNow : What happened? ASX is delisting Company A, and now I can’t access my stocks? I have put at least $27,500 there. Can I get it back?
Brandon996 : Bad luck mate. From the announcement in A S X 200 today, it was delisted 1 week ago. When it is delisted, you only have a sliver of time to cash it out. Your money might have been gone by now.
MikeMoneyNow : Whatt?? Seriously? So there is no way I can get my money back?
Brandon996 : I’m sorry. Better Luck next time….
The exchanges above happen thousands of times on many financial forums, to thousands of investors. What MikeMoneyNow did was a mistake that cost literally 100% of his investment, and you might have experienced it too.
If a stock gets delisted, it means that it can no longer be traded on the stock exchange. That is it.
Delisting can occur for various reasons, including failure to meet listing compliance, and bankruptcy . Immediate effect is that investors experience a decrease in liquidity and difficulty in selling their shares.
Days after the delisting event (say due to bankruptcy), Investors may not be able to trade the stocks anymore, making them lose some or all of their investments.
This is NOT ideal, and NOT good.
Imagine, 5 years of your trading / investment money disappeared because the 1 company you invested in went bankrupt, and hence, delisted.
As an intelligent investor, It is of utmost importance to manage delisting risk by monitoring company performance and credit risk indicators (Securities and Exchange Commission, 2021).
In fact, golden rule no 1 in investment is NEVER LOSE your initial money.
So I’m determined to write the best concise guide to help you fellow investors manage the bankruptcy risk, and avoid the dreaded consequence.
All you need is 1 metric : Altman Z Score
Navigation
What Is Altman-Z Score?

The Altman-Z score is a formula developed by Professor Edward Altman in 1968 to predict the likelihood of a company going bankrupt within 2 years.
It is a class of a credit risk assessment / credit strength test, with a 72% prediction accuracy (Altman, 1968). Subsequent tests in year 2000 shows an even better 80 – 90% accuracy in predicting bankruptcies (Altman et al, 2014).
An interesting note, FCF vs Earnings >> is normally paired up with Altman-Z for liquidity risk checks.
The score (Z) is calculated using a combination of 5 financial ratios (A, B, C, D, E), explained below (Altman, 1968).:
Z = 1.2A + 1.4B + 3.3C + 0.6D + 1.0E
A = Working Capital / Total Assets
B = Retained Earnings / Total Assets
C = Earnings Before Interest and Taxes / Total Assets
D = Market Value of Equity / Total Liabilities
E = Sales / Total Assets
, which is interpreted as follows:
Z-Score > 2.99 = a company is financially healthy
1.8 < Z-Score < 2.99 = a company is in a gray area and may be at risk of financial distress
Z-Score < 1.8 = a company is at high risk of bankruptcy or financial distress.
You have to dig a little bit into the Fundamental Analysis of stocks to calculate those 5 financial ratios, but essentially, we are looking for companies with the score greater than 2.99.
Keep this in mind when you use a stock screener, because most standard stock screener does not have this filter.
QUICK WIN
If you are lazy like me, you can skip all the tedious calculations and find an Altman-Z score for almost any stock for FREE.
Click the link below, and type your stock ticker:
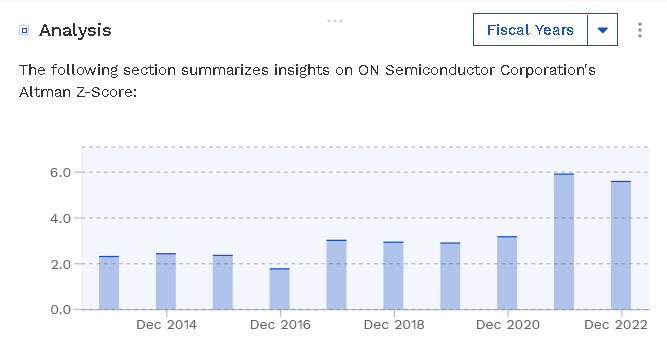
https://finbox.com/NASDAQGS:ON/explorer/altman_z_score
, and then look how the score evolves over time.
Example is ON (On Semi Conductor), where the score improves from 2.3 to above 5 acoss 8 years

How Altman-Z Score Relates To Bankruptcy
and companies being delisted from ASX 200 or Nasdaq…

The Altman – Z score is closely related to bankruptcy risk, of which it causes a public company to be delisted.
By monitoring the score overtime, you can track how safe your stock is from this risk.
E.g. Remember, once a company is delisted due to bankruptcy, say goodbye to 100% of your money in that company.
If your stock ever teeters into the danger zone, you can detect it at least 2 years in advance with 80 – 90% accuracy. And this would enable you to protect your investments e.g. “get your money back” before the delisting event happens (Hargreaves Lansdown, 2021).
Isn’t that great?
Do not Forget Other Financial Ratios Too
Altman Z is just one amongst many financial ratios used to analyze the quality of a company’s shares. Example of other metric is FCF vs Earnings >>.
Your stocks may never be delisted due to bankruptcy, but if it never grows why are you investing in the first place?
Or say if the price is very volatile e.g +50% one day, but -90% the next day, how can you sleep at night?
A good company to invest in is not just “immune” to bankruptcy (can pay short and long term debt), but also profitable, growing, stable (not volatile) and run by a competent management team, amongst many other things.
That is why I developed SFA Investment Class.
A one-year guided class and mentorship in which you learn about all the important criterias, and how to use them so that you can start seeing REAL results.
You’ll have:
- In-depth stock investment knowledge that leaves no stone unturned.
- One-on-one mentoring that will guide you through the entire process.
- Action Plans for applying what you’ve learned to your real-world investments.
- Practical Tips.
- Weekly update of current economic and investing insight.
Furthermore, my team will add you to a private WhatsApp group where you will meet others in the same situation as you, as well as have access to mentors and group discussions.
So, if you’re looking for a resource to help you get REAL guided results, look no further.
You owe it to yourself to check out the SFA Investment Class >>
I guarantee that within the first two months, you will feel far more confident about your investments, and have a solid plan in place to achieve your financial objectives.
I’m looking forward to seeing you in class.

James Lim
SFA Founder
Member of Australian Investors Association (AIA)
The University of Queensland Speaker


