This article is a part of a bigger theme : managing liquidity risk >>
So, you want a company that:
- Give great returns by growing year on year?
- Pays good dividends?
- Has enough liquidity so it lasts forever, e.g. it doesn’t go bankrupt on a 1st sign of trouble?
Who doesn’t? That is all the things you want for a company to do as an investor.
While earnings and revenue are commonly discussed metrics, there’s another important indicator that is more holistic, and encapsulates the above : Free Cash Flow (FCF).
Let’s dive in:
Navigation
What Is Free Cash Flow ?
Free Cash Flow provides valuable insights into a company’s ability to generate cash and acts as a key tool for protecting investments, more so than earnings.
Why?
Essentially, Free Cash Flow determines whether your company you want to invest in has enough cash to:
- repay debts,
- issue dividends
- buy back shares
- grow its business
e.g., all the things you want for a company to do as an investor.
Well, what about earnings? Aren’t they important?
How Looking at Earnings Are “BULLSHIT”

In my view, there are 2 reasons why Free Cash Flow is better in comparison to earnings:
- Earnings are based on accrual accounting and can be influenced by non-cash items, while Free Cash Flow focuses on actual cash generated during a specific period.
- Free Cash Flow is more resistant to “alternative” accounting practices, or being “cooked”. Earnings can be manipulated through accounting practices.
Let me highlight the last point again. “Free Cash Flow is more resistant to accounting manipulation, whereas Earnings are easily manipulated”
And as Charlie Munger said:
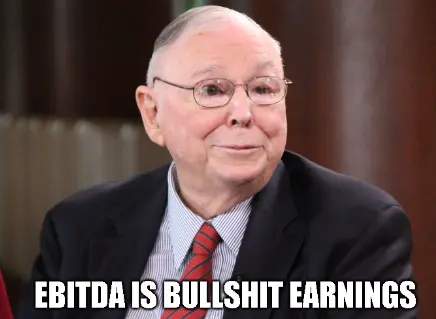
See his wisdom about EBITDA here :
So even if we calculate earnings all the way down to EBITDA, it still severely inflates profitability, and still can be manipulated.
I have seen a lot of companies that I analyze reported great earnings growth year on year, but its Free Cash Flow suggests they are in trouble.
I’m not hinting that they are manipulating the books, but you do wonder sometimes….
This is why we don’t just look at earnings (or just 1 financial metric), but consider all other financial metrics.
You can quickly pick up on oddities in the company, and a company that survives the analysis normally is a good one to invest in.
Using Free Cash Flow To Find A Safe, Profitable, Dividen Paying Company
To start, the formula of Free Cash Flow is below:
Free Cash Flow = Operating Cash Flow – Capital Expenditures
where,
Operating Cash Flow: Cash generated by a company’s core operations. It includes the inflow of cash from sales revenue plus other operating activities minus outflow of cash for operating expenses.
Capital Expenditures: Expenditures to acquire, upgrade, or maintain its long-term assets, such as property, equipment, or machinery. It represents the cash outflow required for investing in the growth and efficiency of the business.
Smart investors would use Free Cash Flow trends to do a quick health check of a company, in parallel with Altman-Z score >>
For even better results, Free Cash Flow is commonly combined with Earnings to form a Free Cash Flow vs Earnings graph.
Depending on the graph trends, we can tell whether the company is in hot water or not.
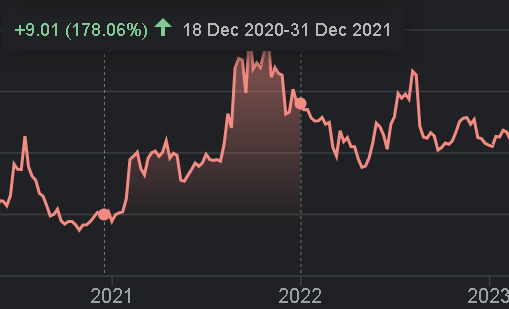
As an example, see Dynavax Technologies (DVAX) below

Between 2021 and 2022, its reporting increased earnings (in light blue) and Free Cash Flow (in purple).
This is a good sign, and the share price reflects that. It jumped by 178%!
However, in 2022 and 2023, it reported increased earnings, but falling Free Cash Flow .
This is a sign that something unhealthy is brewing in the company.
Shortly after, the earnings started to fall, following the Free Cash Flow.
And again, the share prices reflect that. It dipped by 24%.

QUICK WIN
To quickly find FCF vs Earnings graph, you can go to:
And register (for FREE).
The DVAX example given was from this link >>
Don’t forget the rules:
Earnings trending up, Free Cashflow is trending up = Good Sign, no problem with the company
Earnings trending up, Free Cashflow is trending down = Warning Sign, books may be cooked
Earnings trending down, Free Cashflow is trending down = Low evidence that company is cooking the books, but company is likely in hot water sales-wise
Don't Forget Other Financial Ratios Too!
I always stress that we just can’t make an educated decision based on 1 metric alone.
The Free Cashflow vs Earnings graph is a testament to that e.g by combining them together, a clearer picture of the company emerged.
I believe a good company to invest in has to survive a full holistic analysis, meaning:
- Have decent past performance
- Have great future potential
- Undervalued
- Resistant to bankruptcy
- Resistant to bad management decisons
- Have great liquidity that can cover its short term debt
- Failsafe mechanism in the stock (e.g. great dividens) if the company performance goes south
That is why I developed SFA Investment Class.
A one-year guided class and mentorship in which you learn about all the important criterias, and how to use them so that you can start seeing REAL results.
You’ll have:
- In-depth stock investment knowledge that leaves no stone unturned.
- One-on-one mentoring that will guide you through the entire process.
- Action Plans for applying what you’ve learned to your real-world investments.
- Practical Tips.
- Weekly update of current economic and investing insight.
Furthermore, my team will add you to a private WhatsApp group where you will meet others in the same situation as you, as well as have access to mentors and group discussions.
So, if you’re looking for a resource to help you get REAL guided results, look no further.
You owe it to yourself to check out the SFA Investment Class >>
I guarantee that within the first two months, you will feel far more confident about your investments, and have a solid plan in place to achieve your financial objectives.
I’m looking forward to seeing you in class.

James Lim
SFA Founder
Member of Australian Investors Association (AIA)
The University of Queensland Speaker